

“If you can’t measure it you can’t manage it.”
By the time you lead change you’ve been slapped sick with this cliché.
Many change leaders are managers, responsible for KPIs (key performance indicators). The phrase key performance indicators was coined by Art Schneiderman of Analog Devices in 1987, and popularized by David Norton and Robert Kaplan in their writings about the Balanced Scorecard.
The idea was a few simple measures across four perspectives: financial, customer, internal operations, and innovation and learning. The intent was to encourage more metrics than just financial ones to operate the business in an integrated way. Unfortunately this has morphed into measuring everything all the time. Somehow the defining word ‘key” was lost, but now managers cringe at the letters K-P-I.
When managers hear about change metrics, the idea of being held accountable for more KPIs may not fall on receptive ears. Most organizations should reduce the number of metrics rather than increase them.
Screw-up: piling on change KPIs without rationalizing other metrics.
Measuring change – Don’t rely on single lagging metrics
However, change must be measured; otherwise how would you know that you’d changed. Whether a business is improving, or innovating, there is a before and after, a delta.
Managers often talk about a single number, sales of $x, numbers of products shipped, or people trained. Even when managers talk in terms of ratios like return on capital employed (ROCE or earnings before interest and tax/ total assets-current liabilities ) or days sales in Inventory (DSI -products in inventory /daily product sales) it is a single number.
If you watch change leaders they talk in terms of two numbers, the delta. “$X sales last month vs. $Y sales this month and our DSI has moved from ninety days to fifty four days. Production isn’t keeping pace with the increase in sales and if we don’t improve we may face a stockout within six months.”
Successful change leaders talk trends. They understand that change is volatile, sometimes “two steps forward, one step back,” or even sometimes “one step forward two steps back,” but they keep focused on forward progress using overall trends to help.
Screw-up: focusing on a single metric at one point in time, “Profit is down!”
Leading vs Lagging
Profit is a lagging measure. It measures past revenue minus past cost. Many of the common metrics used by managers are lagging i.e., they measure things that occurred in the past that one cannot have an impact on. Theoretically managers manage in a steady-state environment so yesterday’s sales, yesterday’s operations, even last quarter’s net employee attrition numbers or employees trained last year are relevant because this years are likely to be the same.
However when you are making change you want to know things before they happen not after. So it is better to know the new sales calls and the sales cycle, and call conversion rate trends. It is better to know scheduled deliveries of critical parts and planned maintenance or anything that might hinder your products-shipped goal. It is better to know why people are leaving, rather than last quarter’s metrics on net attrition.
Screw-up: waiting for lagging metrics; change leaders need leading metrics, indicators of what will happen before it has already happened. “You mean forecasting? Forecasts are never accurate.”
Leading Metrics Mistakes – The Perils of Forecasting
Forecasting is hard; It is measuring the future. Look at the trouble trained economists have at predicting market growth or recession. Look at how often marketing and sales people miss quotas. Even something that might look simple -a manufacturing production target: There’s materials in inventory or scheduled deliveries. You have labor scheduled. You know machine throughput. What could go wrong? Well, lots actually.
The production target is a future output, a results metric, a forecast. Manufacturing is a process to deliver that result.
A process is:
![]()
There are input measures materials in inventory waste, materials delivery schedule compliance, labor schedule compliance, etc.
Forecasting Screw-ups:
- Not foreseeing problems with inputs – e.g., high materials waste or missed deliveries
- Misunderestimating timing and flow of activities, g., machine breakdowns, strike
- Overestimating outputs – high inspection failure or output waste.
Even very experienced people have trouble with forecasting. Right now the Federal Reserve Bank chairman is wrestling whether to raise interest rates again to slow the economy and lower inflation without causing a recession. They key question is how much lag time is there between higher interest rates (an input) and lower inflation an output and a lagging indicator.
If experienced people have difficulty forecasting what do inexperienced people have? Excel.
The first time I saw this phenomenon the spreadsheet was Visicalc, then Lotus123 and now I have seen it multiple times using Excel.
An analyst, an innovation team lead, a student entrepreneur plugs much known data about new product costs into a spreadsheet, then reverse engineers the revenue line to show the revenue needed to fund the cost line. They end up with a graph that looks something like this: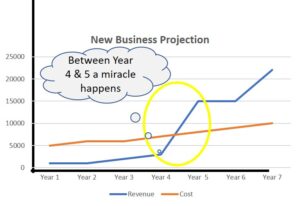
They have no reasoning for why between year four and five; they just know it needs to if the project is to be economic.
Then something strange happens. Because it is in a spreadsheet and spreadsheets are usually used to track known data, lagging metrics that have already happened, they begin to believe and become committed to the projections in the spreadsheet. It was often my job to ask inconvenient questions. “Why does revenue jump between years four and five? What is your action plan to ensure that happens?”
“Er. . . ?”
Whereupon I was known to circle the jump and say “I see. . . between years four and five a miracle happens.” I then label it: Excel enabled wishful thinking.
Screw-up: Having no plans to achieve a forecast and no contingencies if things go wrong.
Unverified Proxy Measures
“You can’t measure that!”
There are things that defy measurement. How would you measure when a product will generate enough word of mouth promotion that sales jump exponentially? How do you measure the difference between run of the mill “satisfied” customer and “delighted” customers who tell everyone they know about your product.
There have been several attempts at this. In the early days of the Internet there were some people whose opinion was such that it could generate word of mouth “virality.” Then using “influencers” became a strategy; now everyone is an influencer.
In 2003 Fredrick Reichheld created the Net Promoter Score (NPS) based upon the answer to the question, “How likely are you to recommend?” It was a “proxy measure” for customer delight.
It was a good proxy, but now many are sick of surveys and fewer people answer them. So is this a still a good proxy for the many companies who adopted NPS.?
This is one of the issues with proxy measures and in fact many leading indicators. They may be created by detailed correlation analysis, but once adopted they become gospel. No one checks the analysis.
When I moved to Pittsburgh in 1981 the office took me up on Mt. Washington to watch the Jones & Laughlin steel mills belching fire into the night. Three years later those mills were gone. Fully integrated mills were replaced by “mini-mills” that made steel from scrap sold through “service centers” that originally sold mill surplus production to small buyers.
I asked a friend who worked with marketing data at US Steel how this trend went unnoticed.
“We always thought of mini-mills as children’s toys and the service centers were just places we dumped stuff we couldn’t sell so we totally missed when their sales volumes ballooned through selling foreign steel and mini output. The biggest problem was that we defined the US market total steel consumption with a proxy measure. We divided the production of the Homestead Works by .12 because every year since before World Ward II, Homestead always had 12% of the market. Then suddenly they didn’t, but we didn’t know that.”
Screw-up: Not consistently monitoring and verifying proxy metrics. Even the most researched leading indicators can change.
Unintended Consequences
“Be careful. What you measure people will do.” This is a lesson we learn repeatedly in business.
In consulting I worked some in call centers, big rooms of gray carpet baffled cubicle where headset wearing customer service representatives (CSRs) CSRs sat staring at computer screens with customer account information. They were usually two or three shift operations with computerized call routing and online metrics on the CSR’s screens.,
CSRs were measured on many metrics and there was often metric conflict. One CSR confided,
“I’m told we want to solve the customer’s problem, but I’m measured and paid bonus based upon average call handle time. So if I get an unhappy customer who’s going to take a while, I disconnect while I’m talking. Then I pick up the next call in the queue. If they call back it’s someone else’s CHT, not mine.”
Screw-up: not examining metrics looking for conflicts and unintended consequences.
Avoiding Change Metric Screw-ups
All metrics are subject to errors. We can have too many metrics, or conflicting metrics or proxy measures that no longer predict outcomes. We can measure things that by measuring produce unwanted behavior or results. In times of change these mistakes may mean the difference between success or failure of the change. Here are some ideas for avoiding these mistakes:
-
If you create a new metric, get rid of one.
-
Find a “glass half empty person, (you know, the pain in the neck who always says stuff like “let’s look at the worst case scenario”). Have that person look at your metric for potential problems.
-
Look at leading indicators and proxy metrics, but constantly revaluate them to be sure they still work.
-
Beware of forecasts, test them for action plans to get there.
-
Create action for when a metric shows something isn’t working.
And remember to share data and encourage people. Change is about more than numbers. Behind every changed number is a person or people doing more of something, less of something, or something differently.


0 Comments